Post at LinkedIn. Process Behavior Charts (aka – SPC).
Process behavior charts allow us to determine when it is economical to take actions to improve a process and when a process should be left alone. This is achieved through the calculation of process limits.
Acting as boundaries between the two types of variation—common causes of routine variation and assignable causes of exceptional variation—process limits separate potential signals from likely noise. They define how large or small a value must be before it represents a departure from the historic mean.
But what happens when we fail to use process behavior charts as the basis for action? What happens when noise and signals are confused for each other?
Failure to discriminate between the two types of variation using process behavior charts leaves improvement efforts susceptible to TAMPERING.
TAMPERING occurs when common causes of routine variation (noise) and assignable causes of exceptional variation (signals) are confused for each other. This confusion is also described as the TWO TYPES OF MISTAKES.
MISTAKE 1 occurs when common causes of routine variation are confused for assignable causes of exceptional variation. Slides 1 and 2 provide an example.
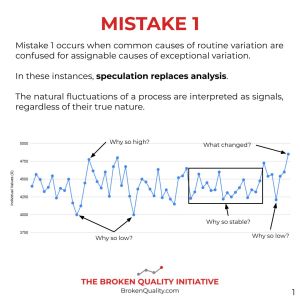
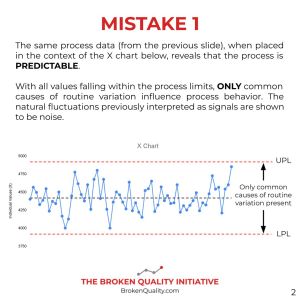
Without the context of the process limits, the natural fluctuations exhibited by the process shown on Slide 1 are interpreted as signals. But the same process, when placed in the context of the X chart on Slide 2, proves to be influenced by ONLY common causes of routine variation—that is, it is PREDICTABLE. Improvements to this process will be realized ONLY through fundamental process changes.
MISTAKE 2 occurs when assignable causes of exceptional variation are confused for common causes of routine variation. This mistake is most often the product of using a specification-based approach to understand process behavior. Slides 3 and 4 provide an example.
All of the values on Slide 3 fall within the specification limits. As a result, it is assumed that no actions need to be taken. However, the same process data, when placed in the context of the X chart on Slide 4, reveals that multiple values fall OUTSIDE the process limits. This process is thus characterized as UNPREDICTABLE. Improvements will be realized by ELIMINATING the assignable causes.
Making either mistake—tampering—is consequential. Process behavior charts help avoid this by discriminating the values in a dataset as either part of the noise or an obvious signal. They allow us to characterize process behavior as either PREDICTABLE or UNPREDICTABLE, and to respond accordingly.
Want to learn more about variation? Visit BrokenQuality.com.
Additional Information
Don Wheeler – Three questions regarding change – DJW225
-
- The Ideal – Why? What do you want to accomplish?
- The Methodology- How? By what method will you accomplish your objective?
- The Judgement – Did the change result in improvement? How will you know when you have accomplished your objective?
